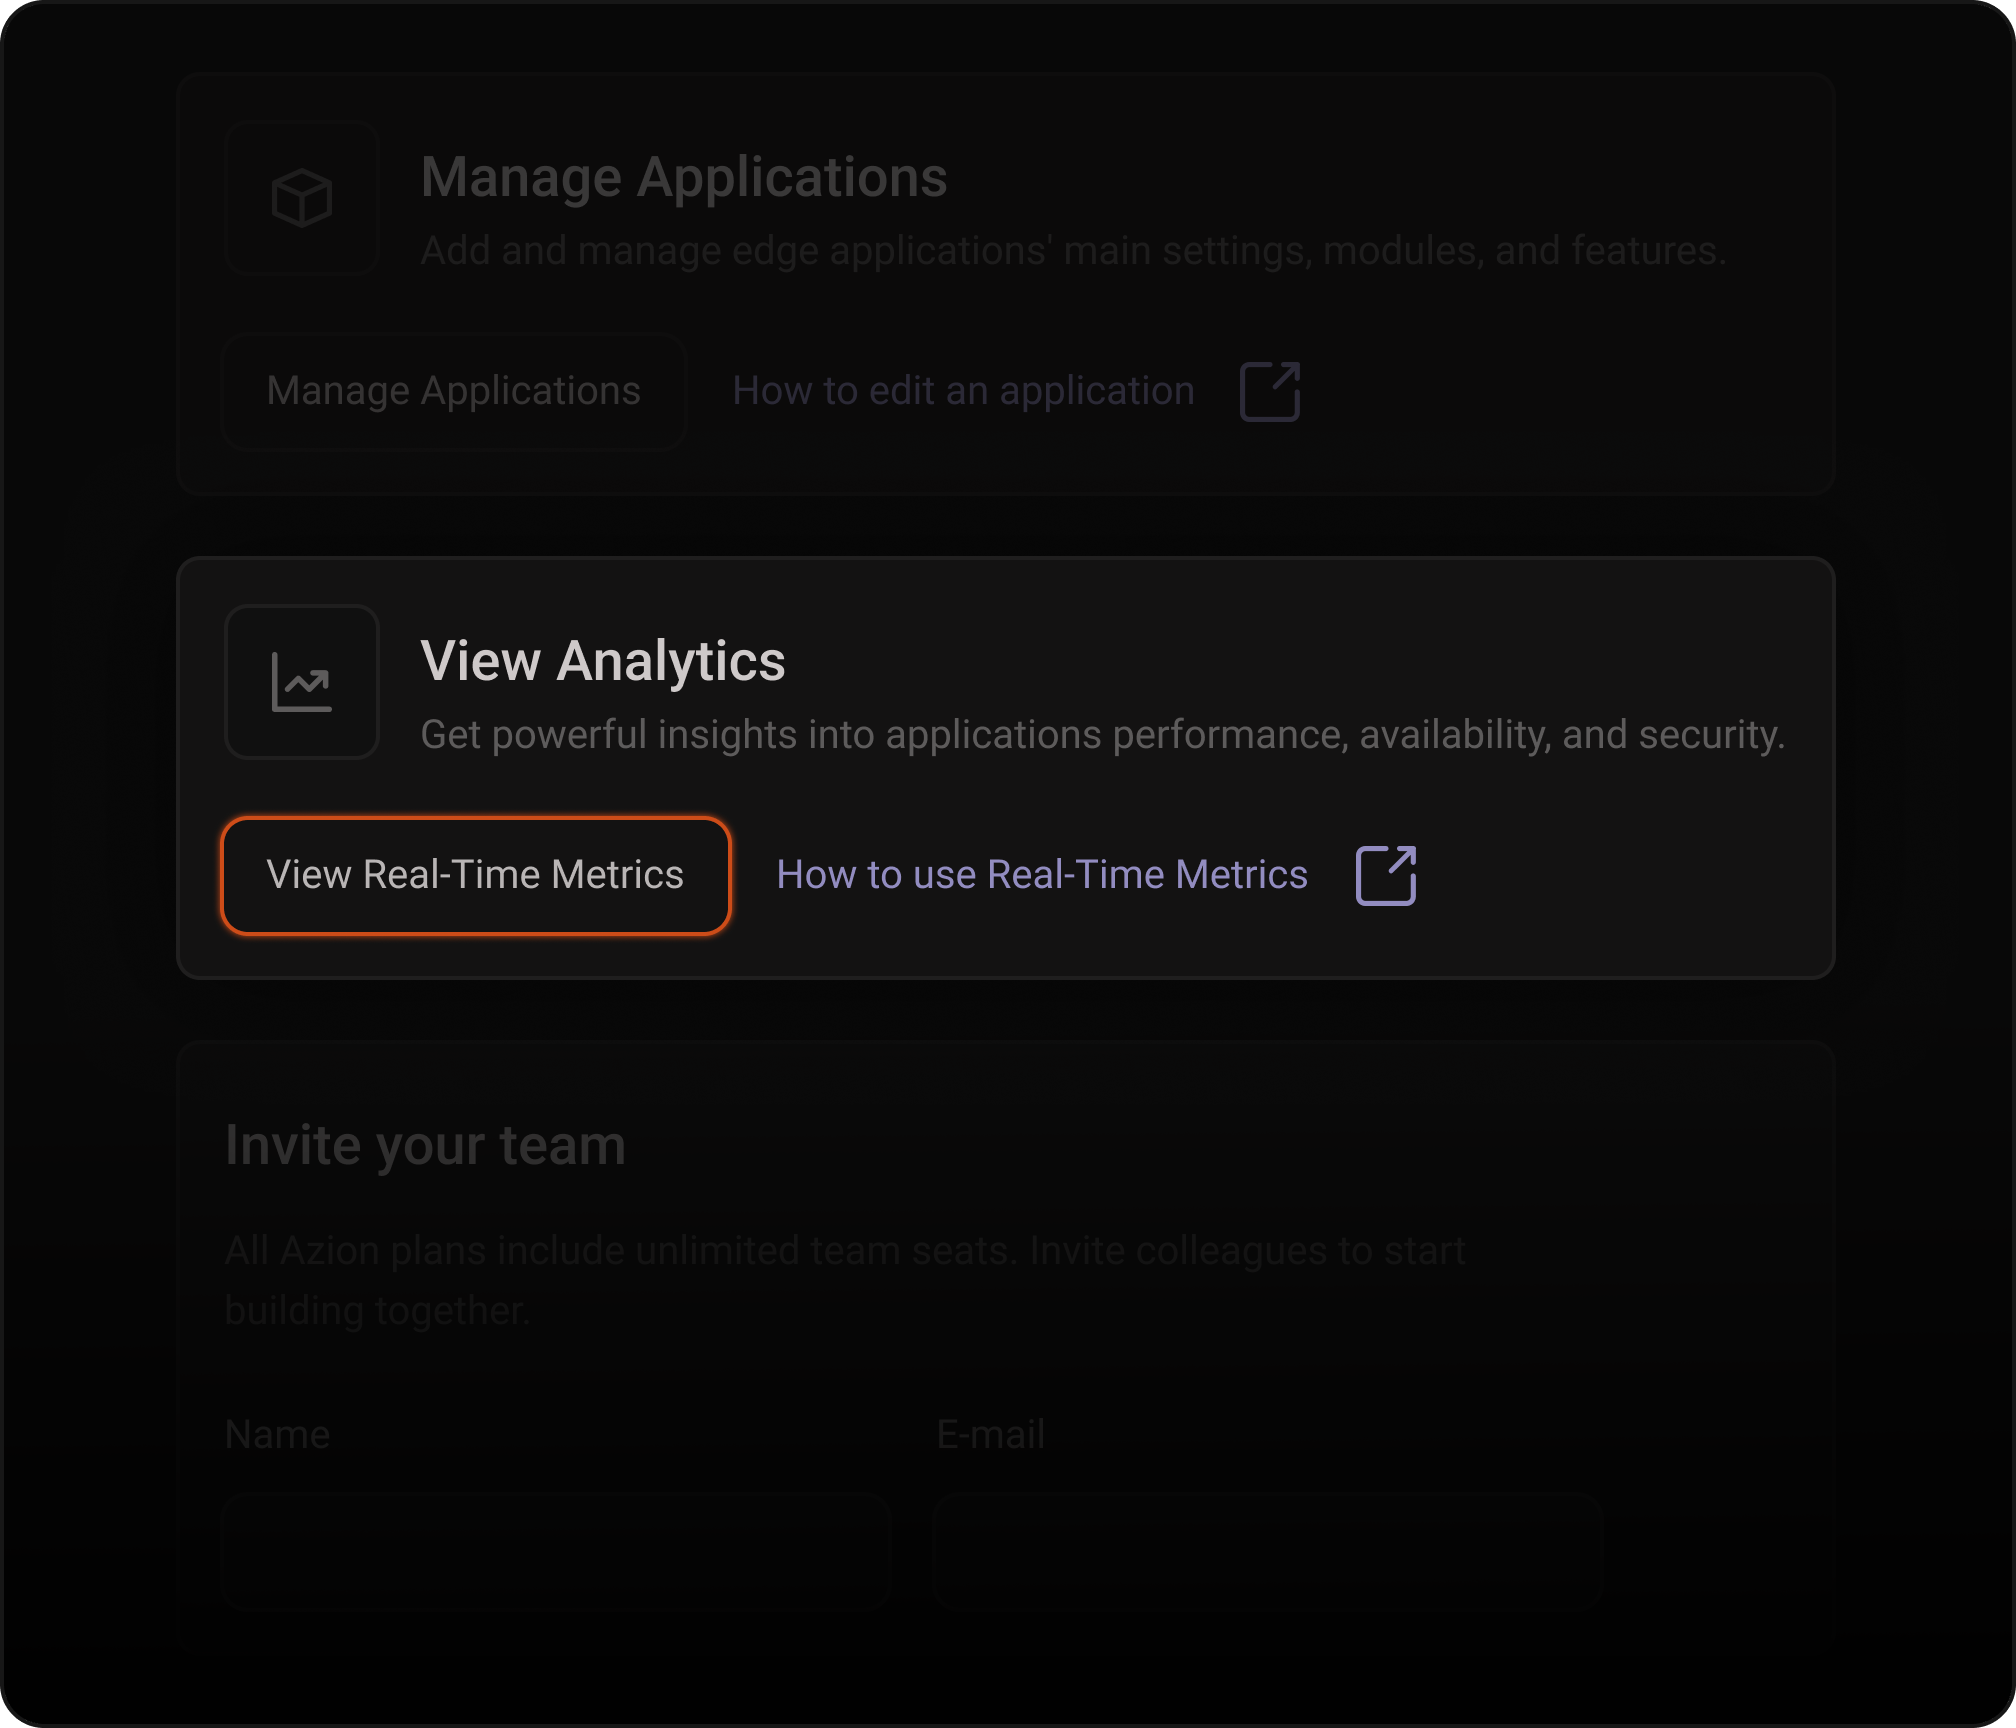
Monitor your application in detail
Monitor traffic, performance, security, and cache metrics across all Azion products with long-term retention and no sampling.


Detect anomalies instantly
Spot traffic spikes and error surges as they happen to react before issues spread across regions.
Optimize application performance
Analyze latency and error rates across dashboards to identify bottlenecks by host or region.
Predict and prevent bottlenecks
Track trends with 24 months retention to forecast capacity needs and optimize scalability.
"Azion shielded us from sophisticated cyberattacks and empowered us to modernize our infrastructure, reduce costs, and deliver the best shopping experiences to millions of customers across Latin America."
Allan Monteiro
CISO & Head of Technology
Metrics visibility across all products
Power operational workflows
Frequently Asked Questions
How often is my data updated?
The maximum time for data aggregation to occur is 10 minutes. When you select the Last Hour time range, Real-Time Metrics automatically refreshes your data every one minute.
How long can I keep historical data?
Azion stores your metrics events and logs for up to 2 years (24 months). The current Real-Time Metrics provides data starting from October 15th, 2022. For earlier data, you can use Historical Real-Time Metrics.
Which products can I monitor with Real-Time Metrics?
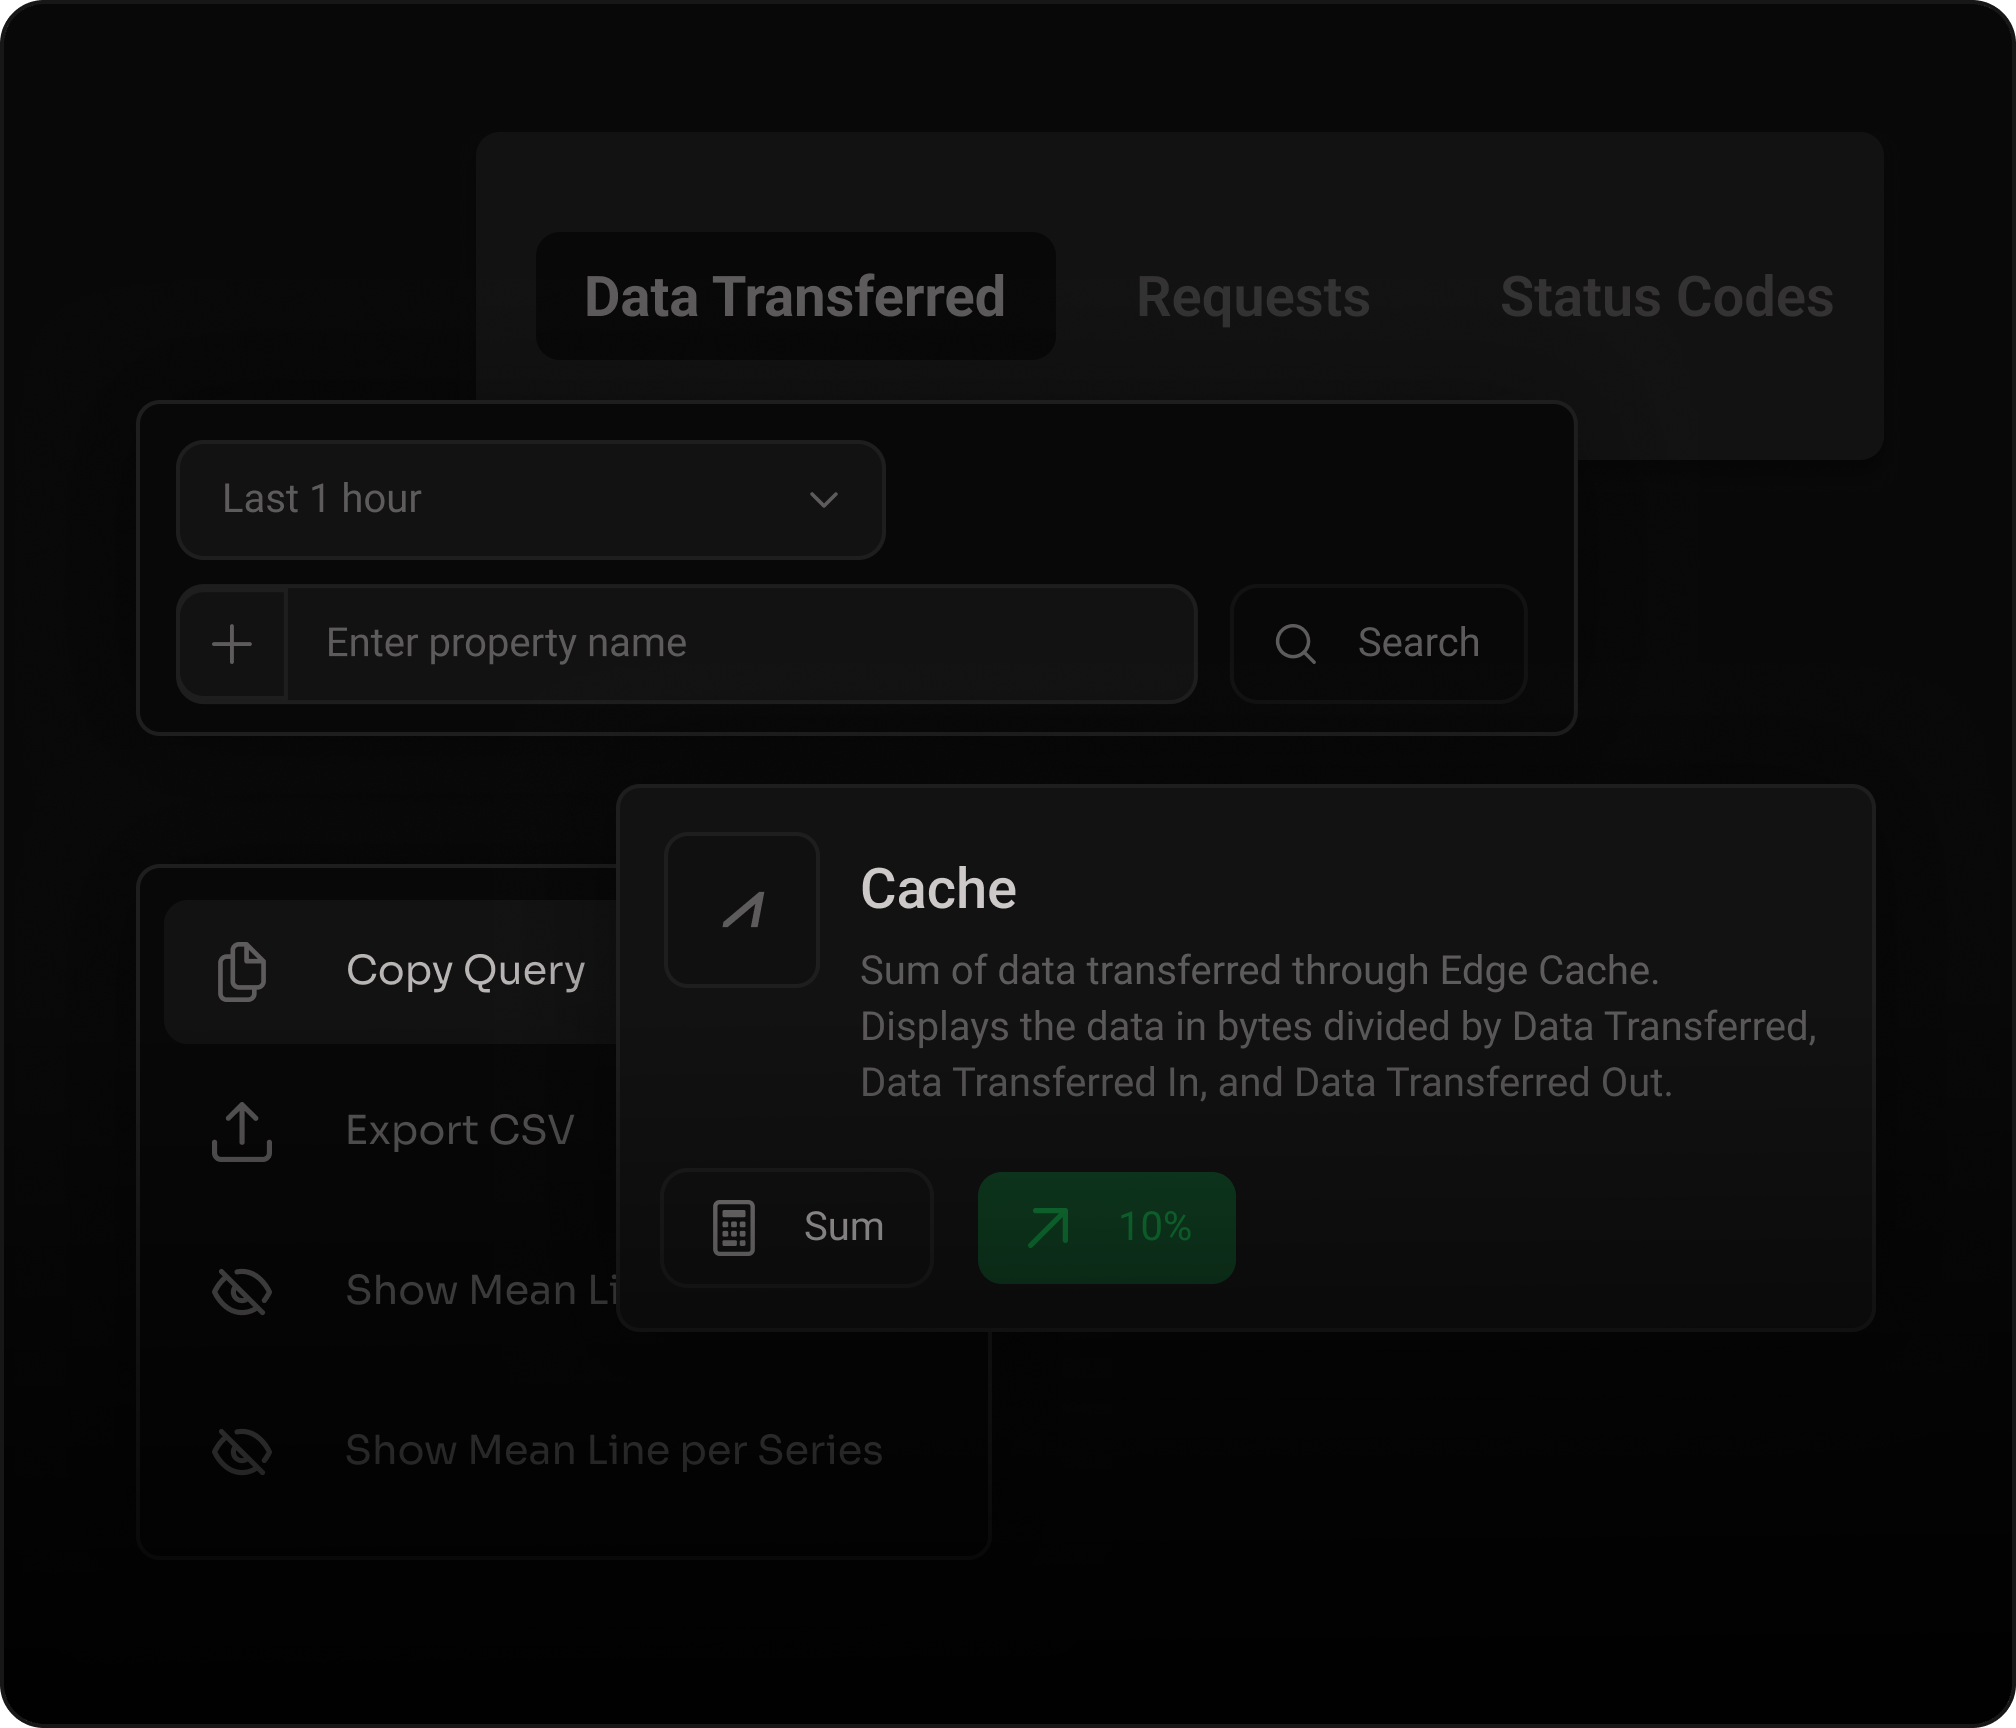
You can monitor metrics across three categories: Build (Applications, Tiered Cache, Functions, Image Processor), Secure (WAF, Edge DNS, Bot Manager, Threats Breakdown), and Observe (Data Stream). Some products like Data Stream, Functions, and Edge DNS require subscription and activation.
Can I access metrics data programmatically?
Yes. Real-Time Metrics fetches data using the Azion GraphQL API. You can copy chart queries directly from the console, use the GraphQL Playground, or build custom dashboards with the Azion Grafana plugin. The API supports up to 10,000 lines per query and 120 requests per minute.
Is sampling used?
No. Real-Time Metrics provides 100% of your data with no sampling. It uses an at-most-once approach focused on performance. On average, the difference between Real-Time Metrics and Azion Billing data is smaller than 1%.
Which time ranges can I select?
You can select from Last Hour, Last 24 Hours, Last 7 Days, Last 30 Days, and Last 6 Months. You can also set custom date ranges using the calendar fields. The timezone matches your user preferences.
Can I filter and share metric views?
Yes. Real-Time Metrics supports advanced filters by host, status code, request method, geographic location, and more. After applying a filter, the URL is updated with an encoded parameter that you can copy and share with other users.
How do I get started with Real-Time Metrics?
Sign up for a free Azion account at console.azion.com/signup and navigate to Real-Time Metrics. Select a product category (Build, Secure, or Observe), choose a time range, and start analyzing your charts. See the first steps guide in the documentation for a detailed walkthrough.
See everything.Act faster.
Talk to our team of experts and start saving money